Logo

AbvarDB Database Help

AbvarDB is a database designed to support researchers and clinicians in analyzing antibiotic resistance and susceptibility profiles in bacterial strains. The database is curated from the BVBRC database and integrates SNP data, allowing for detailed genetic analysis.

Functional Impact Analysis in A. Baumannii Strains

Utilizing tools like SwiftG and PolyPhen with VCF files, we analyze the functional impact of mutations within the Acinetobacter baumannii genome. The SIFT tool assesses amino acid substitutions to determine if they are deleterious, enhancing the accuracy of mutation analysis in AbvarDB.

AbvarDB Database Structure

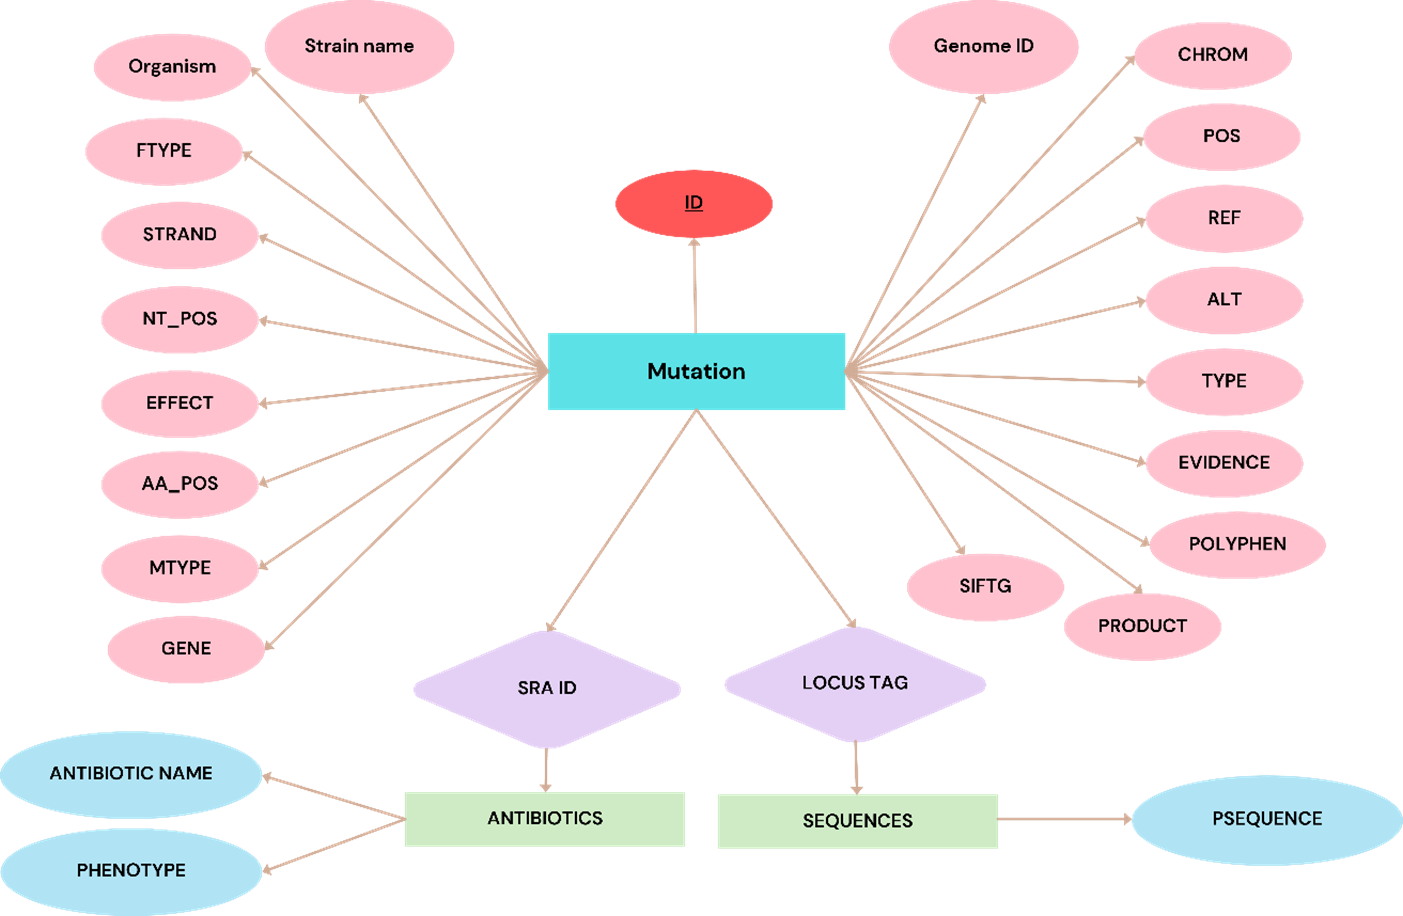
The AbvarDB database consists of three interconnected tables: Variant, Antibiotics, and Sequences. Each table contains specific information related to genetic variations, antibiotic resistance, and genetic sequences. The structure ensures robust data integrity and efficient data retrieval.

AbvarDB Database Schema
Figure 1: AbvarDB Database Schema

User-Friendly Exploration in AbvarDB

AbvarDB allows users to explore antibiotic resistance and susceptibility through two primary data categories: resistant and susceptible strains. The system is designed to be intuitive, offering multiple search approaches and visualization tools for easier data interpretation.

AbvarDB Workflow
Figure 2: AbvarDB Workflow


AbvarDB Query Builder
Figure 3: Query Builder in AbvarDB

Search Approaches in AbvarDB

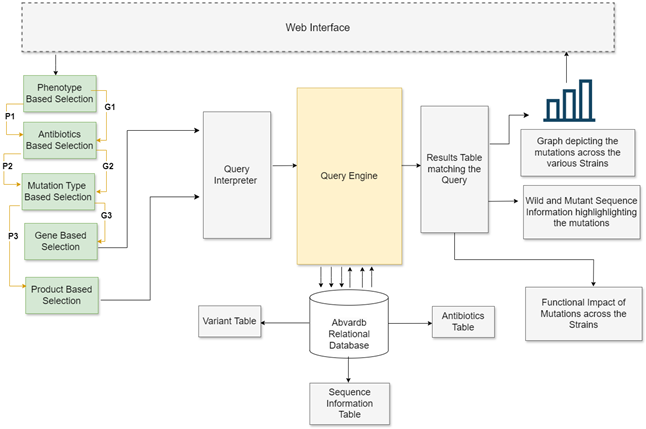
AbvarDB offers two main approaches for search: by phenotype (resistant or susceptible) and by antibiotics. Users can select mutation types, genes, or products, and the database generates comprehensive tables detailing information such as strain, gene, product, mutation, and the functional impact of mutations.

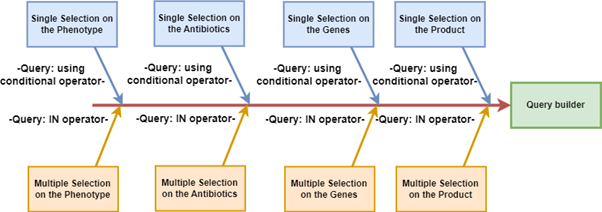
The system supports both single and multiple selections, using conditional operators for single selections and IN operators for multiple selections. This flexibility allows for tailored searches and efficient data retrieval.


In the first approach of the AbvarDB search system, users initiate exploration by selecting a phenotype (G1), indicating resistance or susceptibility to specific antibiotics, retrieved from the AbvardB database using Asynchronous JavaScript and XML (AJAX) and jQuery. The selection box displays the number of entries categorized as resistant or susceptible, enabling users to make single or multiple selections. Subsequently, users proceed to choose antibiotics (G2), each accompanied by its respective count, forming a new category. This selection triggers a custom script, employing AJAX and jQuery, to generate a detailed table (G3) displaying mutation types linked to the chosen antibiotics. When the user chooses the type of mutation, it builds a list of genes based on the user's selection in the type. Upon selecting specific genes, AbvarDB presents a comprehensive table detailing information such as STRAIN, GENE, PRODUCT, MUTATION, and the functional impact of the mutation. Tools like SWIFT and PolyPhen are utilized for functional impact analysis. To augment the interpretability of the SIFT predictions, the PHP GD module was employed to visually annotate the results. A color-coded scheme was implemented, with positions predicted as deleterious highlighted in red and those predicted as tolerant marked in green. This graphical representation provides users with a quick and intuitive overview of the potential impact of mutations on protein function, facilitating the interpretation and prioritization of genetic variants. Another important feature in AbvarDB is the use of filters for each resulting entry, which includes a selection box for customization and information extraction. This feature ensures rapid and pertinent data retrieval, enhancing overall efficiency. Furthermore, AbvarDB graphically displays mutations and their count across various strains in the database using Google Charts. Clicking on a particular mutation from the query hits triggers AbvarDB to exhibit the wild-type sequence alongside the mutant sequence, highlighting the locations of the mutations in a rectangular box.Additionally, the selected mutation also identifies strains containing that mutation as susceptible or resistant and makes a bar graph displaying the susceptible or resistant count of mutations across the strains. In the second approach, AbvarDB follows a similar process for P1, P2, and P3, incorporating the same steps as in G1, G2, and G3. However, instead of using G4, a gene-based search, it introduces P4, a product-based search. The key distinction lies in the focus on products rather than genes. Both approaches support single and multiple selections, employing conditional operators for single selection and IN operators for multiple selections. The combination of searches by G1, G2, G3, G4, P1, P2, P3, and P4 is sent to a Query builder, where the query is formatted and forwarded to the Query engine for processing. This systematic and user-friendly approach ensures seamless exploration of genetic information, aiding researchers in the analysis of antibiotic resistance and susceptibility data.

Graphical Representation in AbvarDB

AbvarDB employs Google Charts to visually represent mutations and their count across various strains. Users can click on a specific mutation to view the wild-type sequence alongside the mutant sequence, with color-coded annotations indicating deleterious and tolerant positions. The system also identifies strains containing a given mutation as resistant or susceptible, providing a bar graph displaying the count of mutations across strains.